Banner
 
General Election
 
July 2024
Full Details
 
December 2019
Full Details
 
June 2017
Full Details
 
May 2015
Full Details
 
May 2010
Percentage Lead
Swing To
Swing From
2nd Place Lead
Marginals
 
May 2005
Percentage Lead
Swing To
Swing From
2nd Place Lead
Marginals
 
June 2001
Percentage Lead
Swing To
Swing From
2nd Place Lead
May 1997
Winning Party
Percentage Lead
Swing To
Swing From
Labour
Conservative
LD / SNP / PC
Mixed Parties
April 1992
Winning Party
Percentage Lead
Swing To
Swing From
Labour
Conservative
LD / SNP / PC
Mixed Parties


UK-Elect General Election Results, December 12th 2019.

Conservatives Majority of 80.

The 2019 UK General Election was won by the Conservative Party, with an overall majority of between 80 and 82 depending on how it is calculated (whether allowing for the Speaker or not, as the Speaker only votes in the event of a tie, but then votes with the Governing Party on votes of confidence).

The GB General Election percentages were were Con 44.73%, Lab 32.90%, Lib Dem 11.84%, SNP 3.98%, Green 2.77%, Brexit Party 2.06%, . For Scotland the actual percentages were SNP 45.03%, Con 25.12%, Lab 18.55%, Lib Dem 9.55%, Green 1.02%, Brexit Party 0.48%, for Wales the percentages were Lab 40.93% Con 36.08%, Plaid Cymru 9.92%, Lib Dem 5.97%, Brexit Party 5.43%, Green 1.02%, and for London the final percentages were Lab 48.13%, Con 32.00, Lib Dem 14.94, Green 3.07%, Brexit Party 1.37%

Why not analyse and forecast General Elections, Scottish Parliament, Welsh Assembly, London Assembly or other UK elections yourself? UK-Elect has a huge amount of functionality, data, maps etc. related to all types of U.K. elections. Make UK-Elect the core of your election experience - Forecast It All!

See also latest statistics, graphics and maps:
UK   Scotland   Wales   London   E England   SW England   SE England   NW England   NE England   West Midlands   East Midlands   Yorks and Humberside   Gains   Losses   Swing To   Swing From   2nd   Conservative Percentages   Labour Percentages   Brexit Party Percentages   Liberal Democrat Percentages   Green Percentages   Conservative Percentages Increase   Labour Percentages Increase   Liberal Democrat Percentages Increase  
Latest: Latest UK-Elect forecast   UK-Elect Home Page

Party Seats Change
Conservative 365 +48
Labour 202 -60
SNP 48 +13
Liberal Democrat 11 -1
DUP 8 -2
Sinn Fein 7 -
Plaid Cymru 4 -
Green 1 -
Alliance (NI) 1 +1
Speaker 1 -
Conservative Maj 80 (82 including Speaker)

See UK-Elect Latest Forecast for the UK-Elect 'Latest Forecast' page.

UK-Elect Election Result Maps
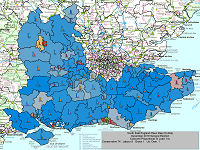
UK General Election Results for UK UK General Election Results for Scotland
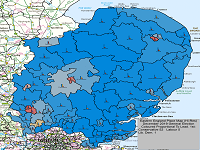
UK General Election Results for Wales UK General Election Results for Eastern England
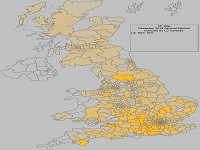
UK General Election Results for London UK General Election Results Gains
Click on image to enlarge. See also more maps.
 
Additional UK-Elect generated maps and screenshots (Click to enlarge)
UK General Election Results for South West England UK General Election Results for South East England UK General Election Results Losses
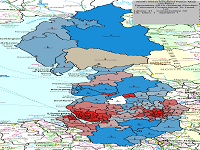
UK General Election Results for North West England UK General Election Results for North East England UK General Election Results 2nd Place
UK General Election Results for West Midlands UK General Election Results for East Midlands UK General Election Results for Yorkshire and Humberside
UK General Election Results - Coloured by most significant 'Swing To' percentage UK General Election Results - Coloured by most significant 'Swing From' percentage UK General Election Results for UK with Gains
UK General Election Results - Conservative percentages UK General Election Results - Labour percentages UK General Election Results - Lib Dem Party percentages
UK General Election Results - Conservative percentages increase UK General Election Results - Labour percentages increase UK General Election Results - Lib Dem percentages increase
Hover cursor over map for more information, click on image to enlarge

Notes: The 2019 General Election was held on Thursday December 12th 2019.


©Copyright 2026 UK-Elect